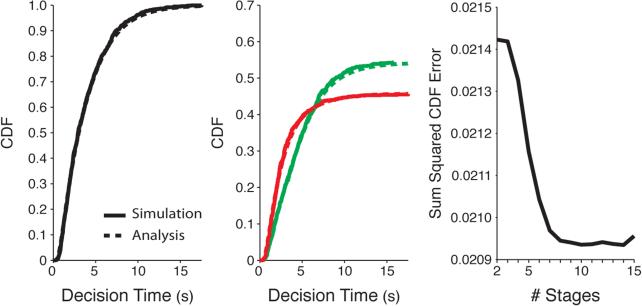
Figure 4.
Unconditional (left) and conditional (middle) FPT distributions for a 20-stage process with gradually increasing drift rate. The drift rate for the i-th stage is μi = −0.2 + 0.0263(i – 1), diffusion rate at each stage is unity, the threshold ζ = 2, and stage initiation times are equally spaced throughout the interval [0, 5]. Right: The total squared error between the simulated and analytic CDFs (left) decreases with increasing discrete stages of the model. 10,000 simulations were used for each approximation.

