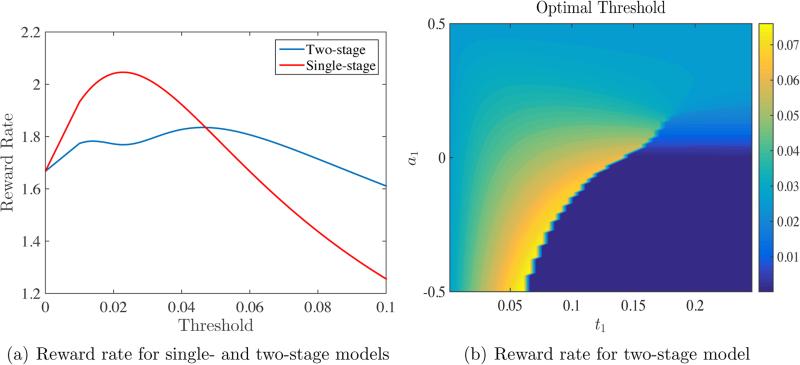
Figure 7.
(a) For the single-stage model μ1 = 0.2, σ1 = 0.1 and x0 = 0, while for the two-stage model μ1 = 0.1, μ2 = 0.5, σ1 = σ2 = 0.1, x0 = 0 and t1 = 0.15. The non-decision time Tnd = 0.3. The reward rate for the single-stage model is a unimodal function and achieves a unique local maximum, while the reward rate for the two-stage model has two local maxima. (b) Optimal threshold for two-stage model obtained by maximizing reward rate. The left panel shows the variation of the optimal threshold as a function of t1 and μ1. The other parameters are μ2 = 0.5, σ1 = σ2 = 0.1, and x0 = 0. The regions of the contour plot associated with t1 = 0 and μ1 = 0.5 correspond to the single-stage model.

