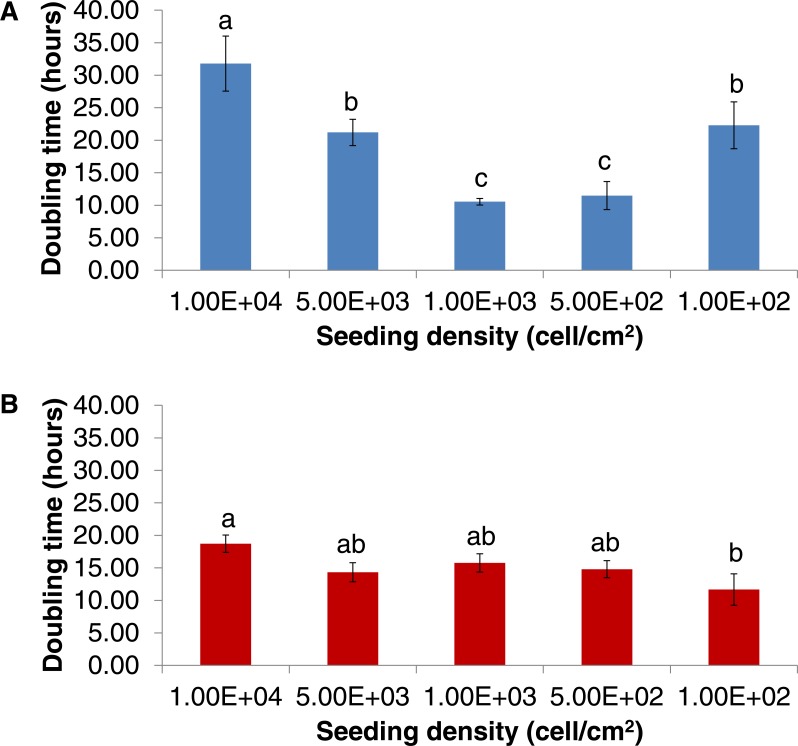
Figure 3. Doubling time of DPSC-OG (A) and DPSC-ED (B).
Cells were seeded at different seeding densities. Doubling time was calculated based on the exponential phase of a growth curve. Comparisons between different densities were made using one-way ANOVA followed by Tukey post-hoc test. Values plotted were mean doubling time ± standard deviation. p < 0.05 was considered as significant as denoted by different letters.

