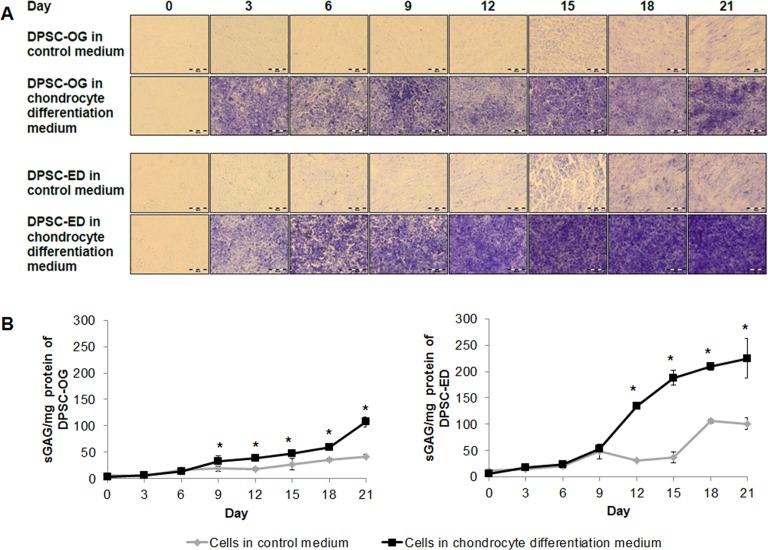
Figure 4. Toluidine blue staining (A) and sGAG content (B) of DPSC-OG and DPSC-ED during chondrocyte differentiation.
DPSC-OG and DPSC-ED was cultured as micromass. Differentiation was carried out using cells in complete proliferation medium as the negative control. (A) The sections of culture stained purple showed the presence of proteoglycan. Scale: 100 µm. (B) sGAG contents was plotted as mean sGAG ± standard deviation. p < 0.05 was considered as significant (*).

