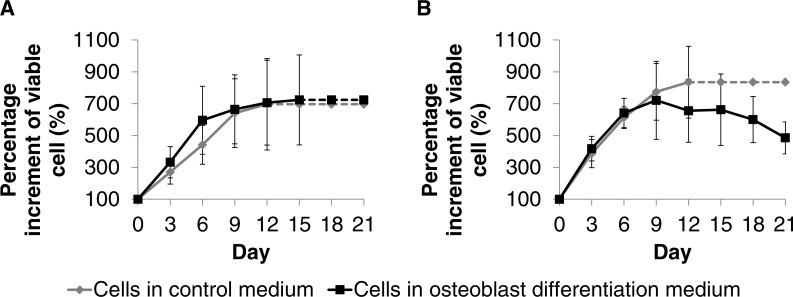
Figure 5. Proliferation analyses for DPSC-OG (A) and DPSC-ED (B) during differentiation to osteoblast.
DPSC-OG and DPSC-ED was cultured in 96 well plate at 2 × 10⁴ cell/cm2 in proliferation medium (control medium) and proliferation medium supplemented with 50 µg ascorbic acid and 10 mM β-glycerophosphate (osteoblastic differentiation medium). The MTT assay was conducted every 3 days for a period of 21 days. The dotted line signifies undetermined percentage increment in viable cells due to unreadable MTT absorbance as the microplate upper limit had been reached. The highest absorbance value read by the microplate reader was ∼3.2 for both samples. Percentage of viable cells increment was fixed at 100% at Day 0. Comparison between the percentage increment of viable cells in the control medium and osteoblastic differentiation medium was conducted using paired T-test. * denotes significant difference (p < 0.05). Values were plotted as mean percentage of viable cell increment ± standard deviation.

