
Figure 2.
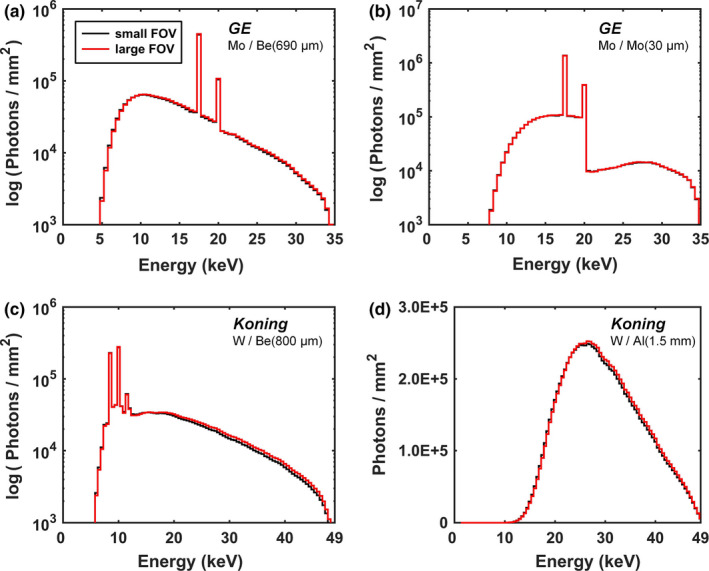
Example comparisons of Monte Carlo simulation results for differences in the solid angle at the detector for a large and small breast size. GE Mo spectra at 35 kV (a) minimally filtered, and (b) filtered with 30 μm Mo are shown. Koning W spectra for bCT at 49 kV (c) minimally filtered, and (d) filtered with 1.5 mm Al are also shown. All comparisons clearly demonstrate that differences in the solid angle at the detector for a large and small breast size has no significant impact on the resulting spectral shape after conventional filtration is applied. The large focal spot size was used for all FOV comparisons and all spectra are normalized to unity air kerma. A log scale is used for the y‐axis when characteristic emission lines are present (a–c) in order to more easily depict spectral comparisons. [Color figure can be viewed at wileyonlinelibrary.com]