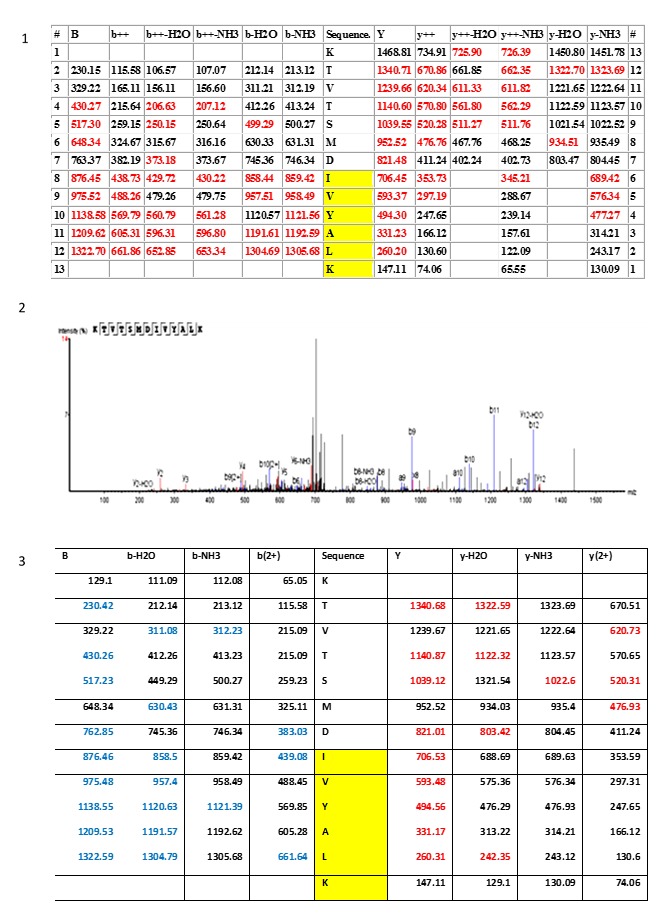
Figure 10. Mass spectrometry fragmentation patterns of the histone H4 variant (IVY).

Section 1 and section 2 illustrate the fragmentation table and the spectrum (PEAKS software) of the ancestral variant of the histone H4 peptide KTVSMDIVYALK, respectively. Section 3 is the fragmentation table of the synthetic peptide that was synthesized and used to validate the KTVSMDIVYALK identification. Fragment ions that matched the spectrum in both the biological and synthetic spectrum are highlighted in colour. Red = xyz ions; blue = abc ions. The yellow region IVYALK indicates the histone H4 variant that was detected, along with the conventional histone H4, in the human cells. The same pattern IVY is also present in the histone H4 biology of polydnaviruses.
