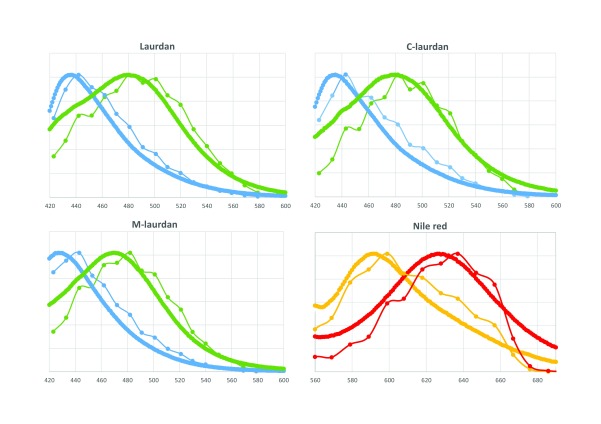
Figure 5. Emission curves obtained with the biphoton microscope are very similar to those obtained on a standard spectrofluorimeter.
The four fluorescent lipid probes were inserted into either Lo or Ld MLVs and their emission curves were recorded in cuvettes on a spectrofluorimeter (thick lines), or imaged on the biphoton microscope in the same conditions as used for live cells. After defining appropriate ROIs in the lambda stacks, the emission curves of individual MLVs were extracted using the ImageJ software. The thin lines correspond to the average curves obtained from 6–10 separate MLVs (the error bars are smaller than the symbols). Lo, DPPC–chol MLVs (blue or orange); Ld, DOPC MLVs (green or red).

