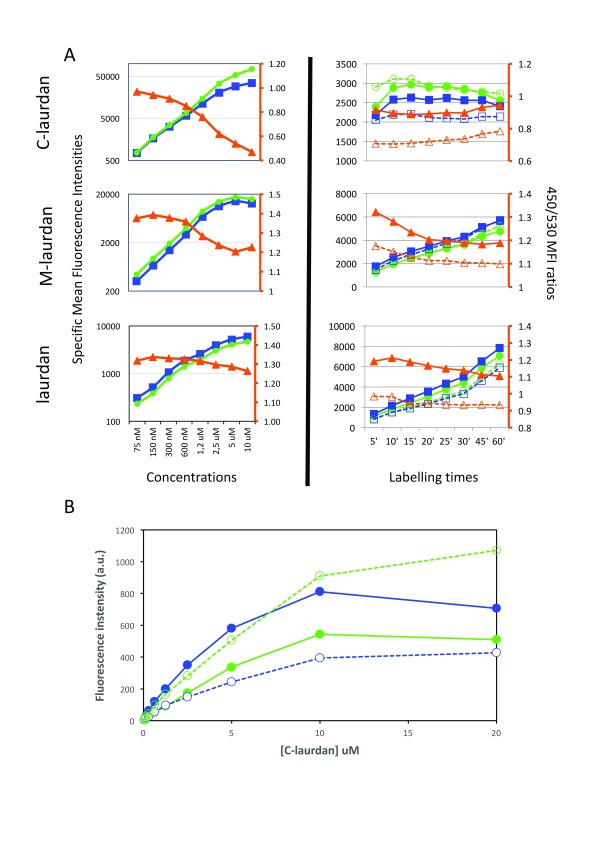
Figure 8. Using flow cytometry (FACS) to quantify staining intensities at 450 and 530 nm, as well as the ratio between the two.
( A) FACS was used to quantify the mean fluorescence intensities (MFIs) of Hela cells labelled with C-laurdan (top), M-laurdan (middle) or laurdan (bottom). Blue squares indicate MFI at 450 nm and green circles indicate MFI at 530 nm, as plotted on the y-axis on the left side of each plot. Orange triangles indicate the ratio of 450/530 MFIs as plotted on the orange y-axis on the right side of each plot. The plots in the left column show dose–response curves after labelling cells at 37°C for 60 minutes. The plots in the right column show time courses of cells labelled at 37°C with either 200 nM C-laurdan, 500 nM M-laurdan or 4 µM laurdan. The unfilled blue squares and orange triangles indicate measurements as for the filled symbols, but on cells treated with 5 mM MßCD for 30 min at 37°C before labelling. ( B) The preferential autoquenching of C-laurdan in Lo environments, suggested by the drop in the 450/530 ratio in the FACS analysis of cells labelled with high concentrations of the probe, can also be seen in MLVs analysed on a standard spectrofluorimeter. Serial two-fold dilutions of C-laurdan in DMSO were added (1% vol), whilst vortexing, to aliquots of MLVs prepared either with DOPC (Ld, dotted lines) or with DPPC–chol (Lo, continuous lines). After 20 min incubation at 37°C, the emission spectra of each aliquot were recorded in quartz cuvettes in a standard spectrofluorimeter (excitation: 360 nm), and the fluorescence intensities at 440 nm (blue lines) and 490 nm (green lines) were plotted against the concentration of C-laurdan.

