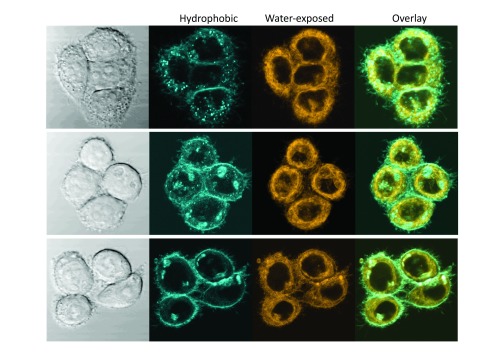
Figure 9. After spectral decomposition, the staining patterns obtained with laurdan, M-laurdan and C-laurdan are similar, but C-laurdan labels the PM better than the other two probes.
Live Hela cells grown on glass coverslips for two days were labelled with either 2uM laurdan (top row), 500 nM M-laurdan (middle row) or 200 nM C-laurdan (bottom row), as described in Methods. Lambda stacks were then acquired by biphoton microscopy of the live cells at 37°C, and spectral decomposition was carried out, all with the standard conditions specified in Methods. Left column, transmitted light; second column (cyan), decomposed fluorescent signal corresponding to the probes in an apolar (hydrophobic) environment; third column (orange), decomposed fluorescent signal corresponding to the probes in a polar (water-exposed) environment; fourth column, overlay of the signals shown in the second and third columns.

