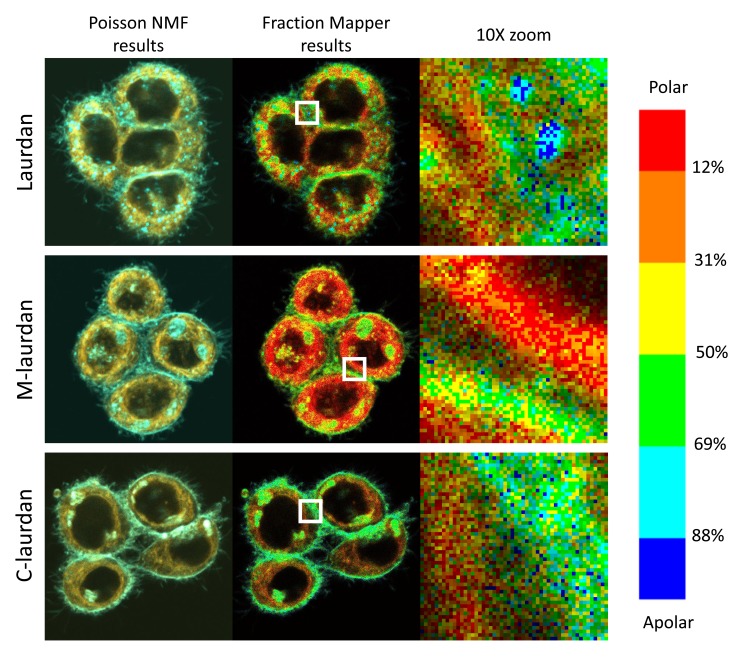
Figure 11. Fraction Mapper gives a much clearer picture of the relative polarity of the lipid environment in various cellular compartments than two-colour overlay.
In the middle column, the Fraction Mapper plugin was used on the two-colour stacks from Figure 9 (shown in left column), which were obtained by spectral decomposition using PoissonNMF. The right column shows 10x magnifications of the 52×52 pixel regions indicated by white squares in the middle column. Each pixel is 100×100 nm and the whole pictures cover 52×52 microns. Top row, 2uM laurdan; middle row, 500 nM M-laurdan; bottom row, 200 nM C-laurdan.

