Figure 1.
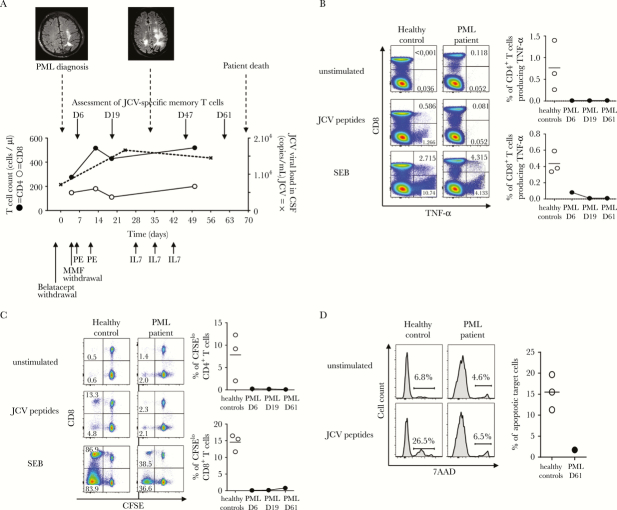
Clinical, neuroradiological, and immunobiological monitoring of progressive multifocal leukoencephalopathy (PML). (A) shows the time course of PML, with fluid attenuation inversion recovery-sequence magnetic resonance imaging aspect at PML onset and 33 days later, the different therapeutic approaches, as well as changes in the CD4 T-cell count (closed circles), the CD8 T-cell count (open circles), and JC virus (JCV) viral load in cerebrospinal fluid (dashed line). (B–D) illustrate anergy of anti-JCV T-cell responses. Peripheral blood mononuclear cells were incubated in Roswell Park Memorial Institute medium alone (unstimulated cells) or with overlapping JCV peptides or Staphylococcal enterotoxin B (SEB). T-cell functionality was evaluated in the PML patient and in representative healthy donors responsive to JCV. (B) Tumor necrosis factor (TNF)-α production in response to JCV peptides was evaluated by intracellular staining. Numbers indicate the percentages of CD8+ or CD8− (CD4+) T cells expressing TNF-α. Similar results were found for interferon-γ (data not shown). (C) Proliferation in response to JCV peptides was measured by carboxyfluorescein diacetate succinimidyl ester (CFSE) dilution. Numbers indicate the percentage of CFSElow cells among CD8+ or CD8− (CD4+) T cells. (D) Cytotoxicity for JCV-coated target cells was measured in terms of 7-amino-actinomycin D (AAD) uptake. Results are expressed as the percentage of 7-AAD-positive target cells. (B–D) show the lack of improvement in JCV-specific T-cell functions during the course of PML (from D6 to D61). The frequencies of responsive JCV-specific T cells were calculated by subtracting the frequency of cells detected in the absence of stimulation, to correct for background staining. The horizontal bar indicates the median value obtained with cells from 3 healthy donors responsive to JCV. Abbreviations: CSF, cerebrospinal fluid; IL, interleukin; PE, plasma exchanges.

