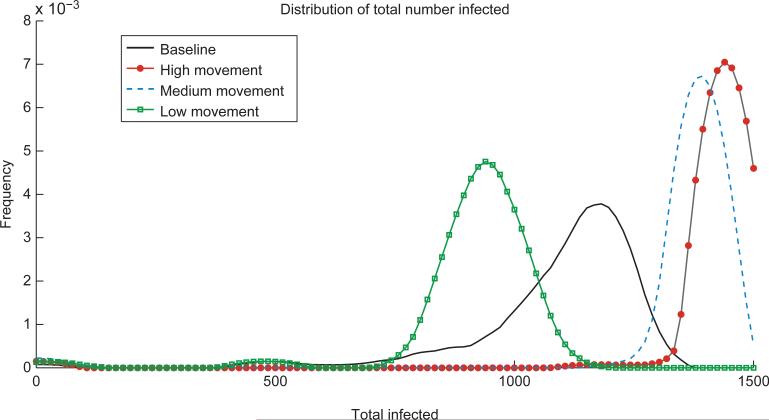
Figure 3.
Distribution of the total number of people infected over the course of the simulation (200 days) for each scenario. Each scenario was run 100 times to capture intrinsic uncertainty due to stochasticity. The pathogen is introduced into a fully susceptible population of 1500 hosts with no mitigations implemented. In the heterogeneous scenarios with one high risk patch and high or medium human movement, the total consequence is higher than for the baseline homogeneous scenario. However, with low movement between patches, the scenario with one high risk patch results in lower total consequence than the baseline.

