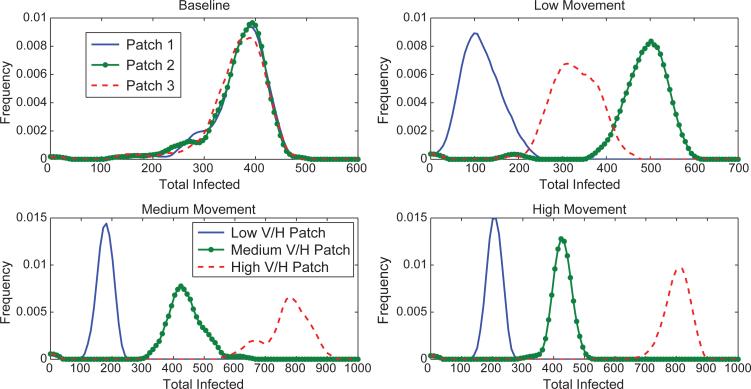
Figure 4.
Distributions of the total number of hosts initially infected in each patch for the different scenarios. For the baseline case, all patches have the same density of mosquitoes and each patch is responsible for approximately the same number of initial infections. For the heterogeneous scenarios, red dashed is the high risk patch, green dotted the medium risk and blue solid the low risk patch. For high and medium host movement, the highest risk patch is responsible for the most infections. For the low movement scenario, the medium risk patch is responsible for the most infections and the low risk patch is responsible for the fewest. This difference from the high/medium movement scenarios can be explained by the fewer number of resident hosts in the high risk patch. Since movement between patches is low in the low movement scenario, the high risk patch runs out of susceptible hosts faster.

