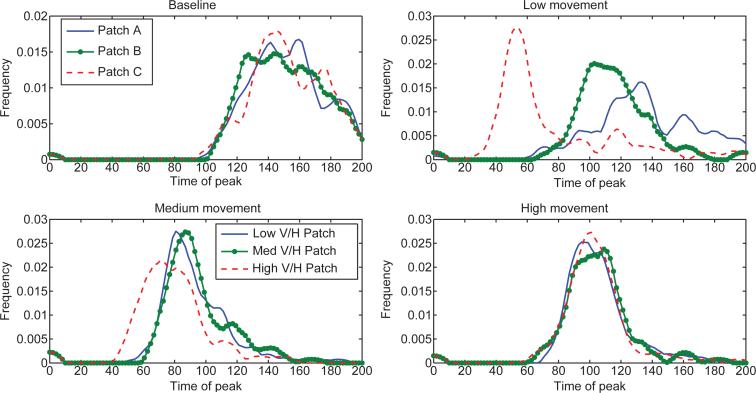
Figure 6.
Distributions for the timing of the peak of the epidemic in each patch. For the low and medium movement scenarios, the high risk patch peaks before the other patches in general. For the high movement case and the baseline case, the patches reach the epidemic peak at approximately the same time. The low movement scenario has the most variation is epidemic timing.

