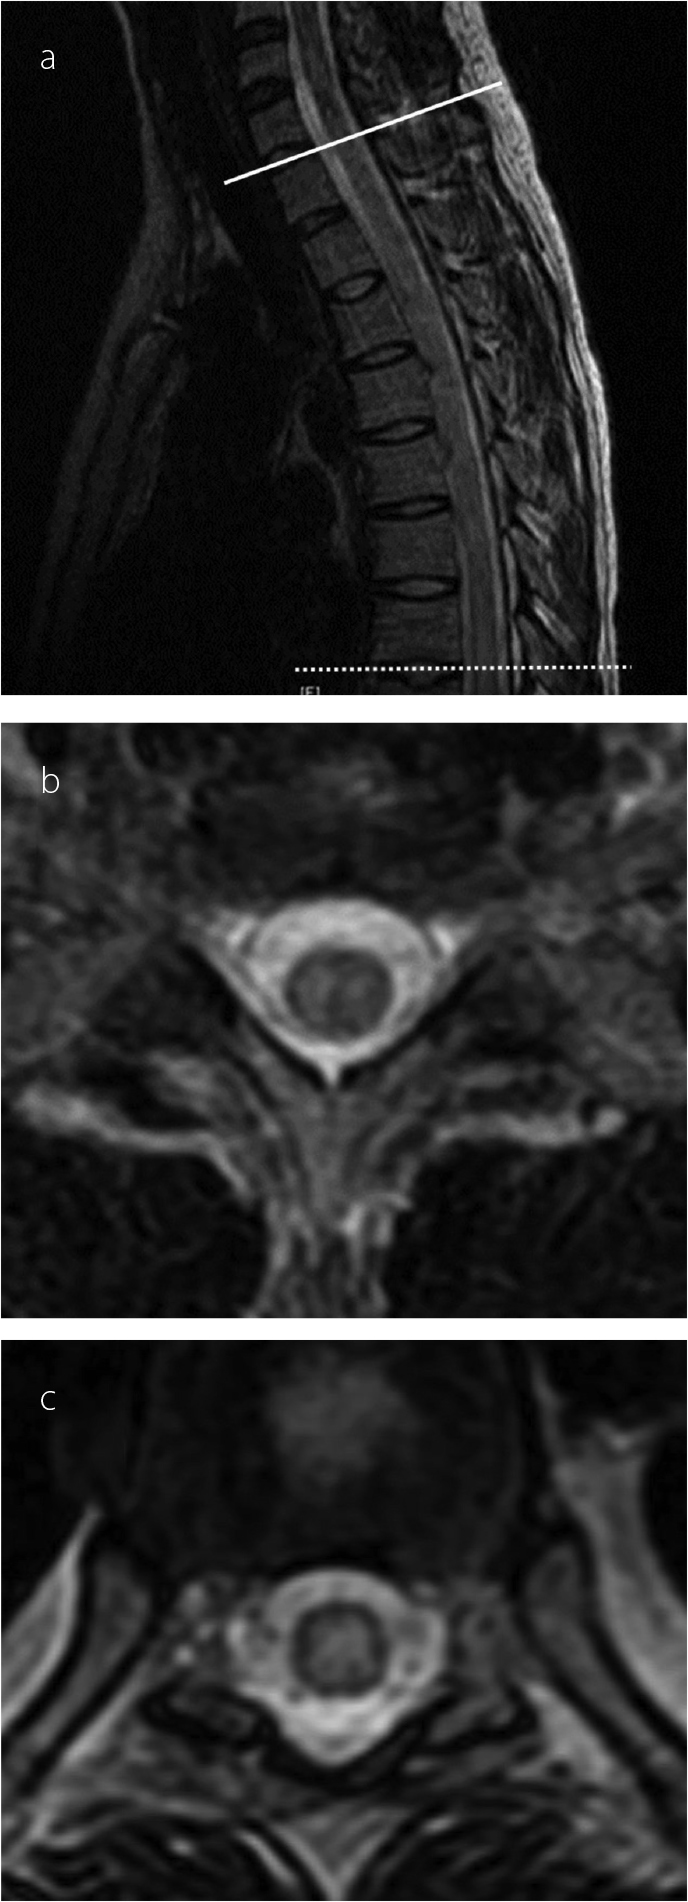
Figure 1 a–c.

Sagittal T2-weighted magnetic resonance image of the spine in Case 2 demonstrating high intensity in the spinal cord. A solid line is drawn between the seventh cervical vertebra and the first thoracic vertebra, and a dotted line is drawn between the seventh and eighth thoracic vertebrae (a). Transverse views between the seventh cervical and first thoracic vertebrae (b) and between the seventh and eighth thoracic vertebrae (c) also show a high-intensity intraspinal area.
