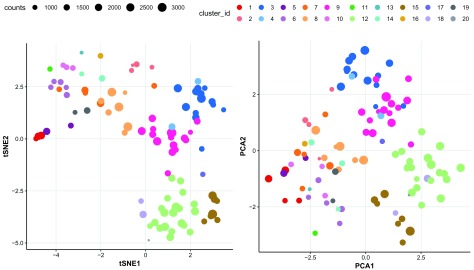
Figure 13.
The 100 SOM codes in the PBMC dataset colored according to the metaclustering with Consen-susClusterPlus into 20 cell populations presented after the dimension reduction with ( A) t-SNE and ( B) PCA. The SOM codes represent characteristics of the 100 (by default) clusters generated in the first step of the FlowSOM pipeline. The size of the points corresponds to the number of cells that were assigned to a given code.

