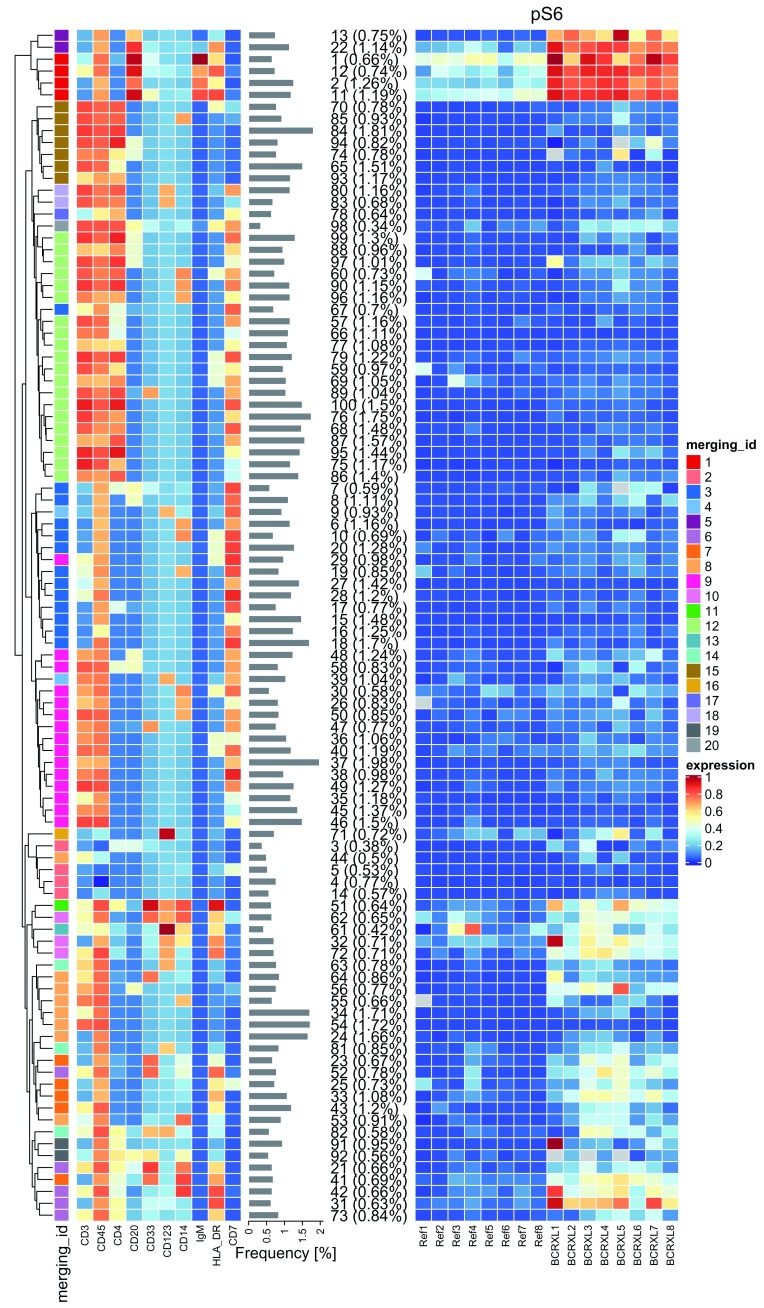
Figure 14. Heatmap of the median marker intensities of the 10 lineage markers (left panel) and one signaling marker pS6 (right panel) across the 100 SOM codes in the PBMC dataset.
The color in the heatmap represents The color in the heatmap represents the median of the arcsinh, 0-1 transformed marker expression calculated over cells from all the samples, for the lineage markers, and over cells in each sample individually, for the signaling marker. The heat varies from blue for lower expression to red for higher expression. The dendrogram on the left represents the hierarchical similarity between the 100 codes (metric: Euclidean distance; linkage: average). The annotation bar on the left is colored according to the code metaclustering with ConsensusClusterPlus into 20 cell populations. The relative size of the codes is shown in parentheses next to the cluster numbers.

