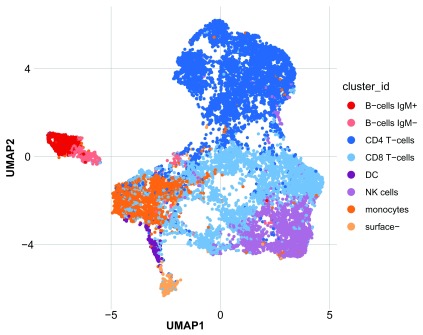
Figure 15. UMAP plot for the PBMC dataset, where cells are colored according to the manual merging of the 20 cell populations, obtained with FlowSOM, into 8 PBMC populations.
As in 10, UMAP uses the arcsinh-transformed expression of the 10 lineage markers in 1000 randomly selected cells from each of the 16 samples.

