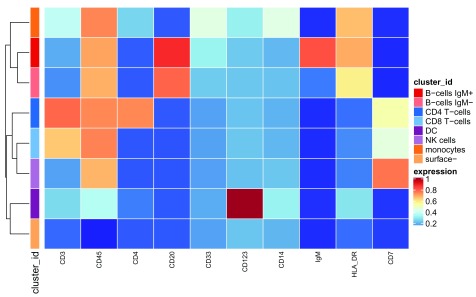
Figure 17. Heatmap of the median marker intensities of the 10 lineage markers in the 8 PBMC cell populations obtained by manual merging of the 20 metaclusters generated by FlowSOM.
As in Figure 6, the heat represents the median of arcsinh and 0-1 transformed marker expression calculated over cells from all the samples. The dendrogram on the left represents the hierarchical similarity between the 8 populations calculated using Euclidean distance and average linkage.

