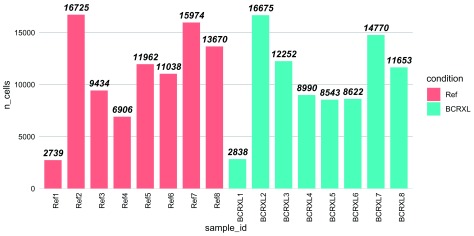
Figure 2. Barplot showing the number of cells measured for each sample in the PBMC dataset.
Bars are colored by experimental condition: unstimulated (Ref) and stimulated with BCR/FcR-XL (BCRXL). Numbers in the names on the x-axis indicate patient IDs. Numbers on top of the bars indicate the cell counts.

