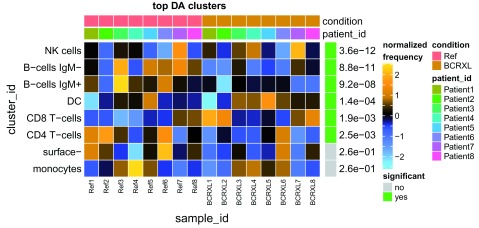
Figure 22. DA test results and normalized proportions for PBMC cell populations in BCR/FcR-XL stimulated and unstimulated conditions.
The heat represents arcsine-square-root transformed cell frequencies that were subsequently normalized per cluster (rows) to mean of zero and standard deviation of one. The color of the heat varies from blue indicating relative under-representation to orange indicating relative over-representation. Bars at the top of the heatmap indicate patient IDs and the condition the samples (columns) belong to: red for the unstimulated (Ref) and brown for the stimulated with BCR/FcR-XL (BCRXL) condition. Bar and numbers at the right indicate significant differentially abundant clusters (green) and adjusted p-values. Clusters are sorted according to adjusted p-values, so that the cluster at the top shows the most significant abundance changes between the two conditions.

