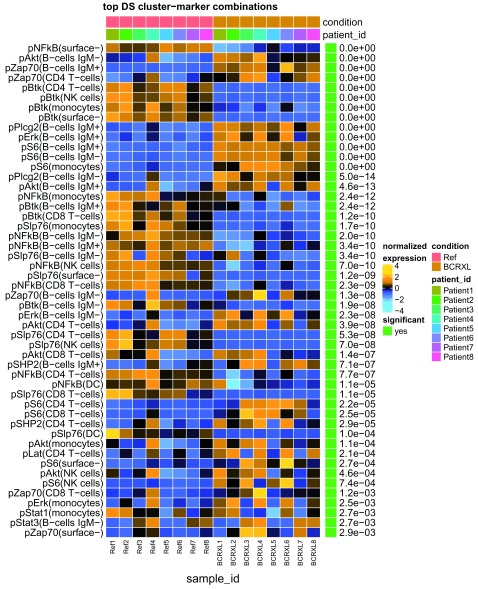
Figure 24. DS test results and normalized expression of signaling markers in PBMC populations in BCR/FcR- XL stimulated and unstimulated conditions.
The heat represents median (arcsinh-transformed) marker expression that was subsequently normalized per cluster-marker combination (rows) to mean of zero and standard deviation of one. The color of the heat varies from blue representing relative under-expression to orange representing relative over-expression. Bars at the top of the heatmap indicate patient IDs and the condition the samples (columns) belong to: red for the unstimulated (Ref) and brown for the stimulated with BCR/FcR-XL (BCRXL) condition. Bar and numbers at the right indicate significant differential cluster-marker combinations (green) and adjusted p-values. Cluster-marker combinations are sorted according to adjusted p-value, so that the cluster-marker combinations at the top show the most significant differential signals between the two conditions. Shown are only the top 50 most highly significant cluster-marker combinations.

