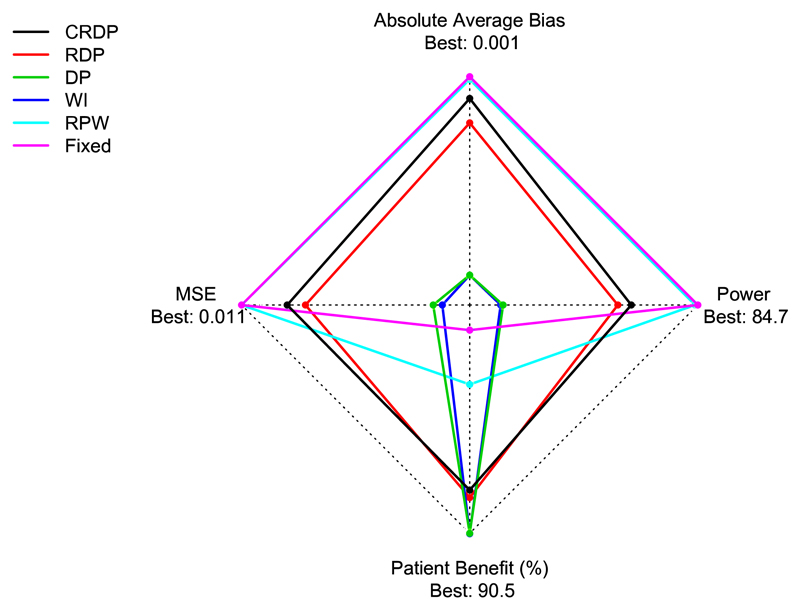
Fig. 5.
Star plot showing the performance of each design with respect to power, patient benefit, absolute average bias of the treatment effect estimator and MSE when n = 75, θA = 0.5 and θB = 0.2. The best achieved values for each performance measure are depicted at the outer edge. (Note that the average bias and MSE axes have been inverted so that the smaller (favourable) values are towards the outer edge, unlike the power and patient benefit axes which have their larger values towards the outer edge.)

