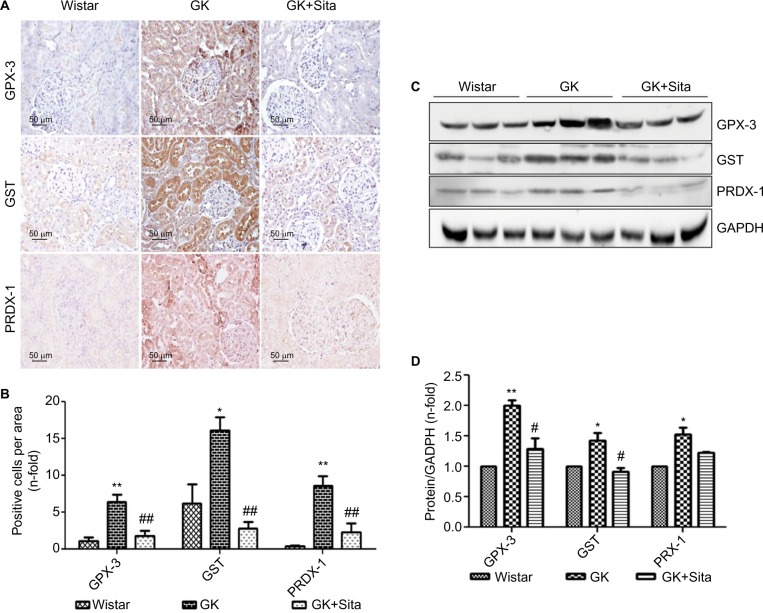
Figure 3.
Antioxidant protein expression in the GK model. (A) Immunostaining for GPX-3, GST and PRDX-1 in the kidney from Wistar, GK and GK+Sita rats at 9 months (n=6). Original magnification: 20×. (B) Values were represented in graphic as positive cells per area. Data are mean±SEM. *p<0.05 GK vs. Wistar; **p<0.01 GK vs. Wistar; ##p<0.01 GK-Sita vs. GK. (C) Representative western blot of GPX-3, GST and PRDX-1, as mean ± SEM of n=6 rats. (D) Results of total protein expression were obtained from densitometry analysis and expressed as the ratio protein/GADPH as n-fold over Wistar. *p<0.05 GK vs. Wistar; **p<0.01 GK vs. Wistar; #p<0.05 GK-Sita vs. GK.
Abbreviations: GK, Goto-Kakizaki; SEM, standard error of the mean.

