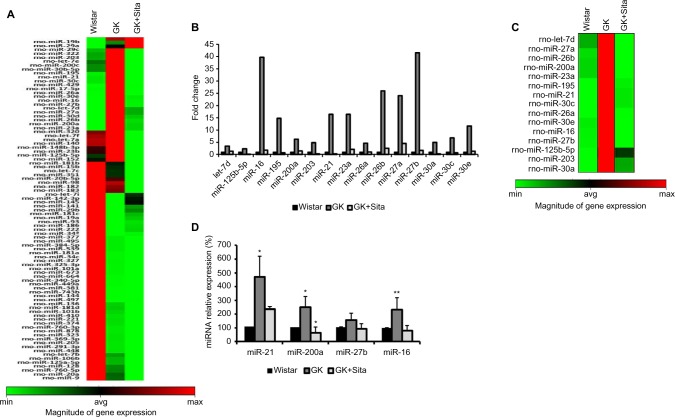
Figure 4.
Microarray profiling of miRNAs expression in diabetic kidney. (A) Heat map diagram and hierarchical clustering of differential expression of miRNAs between Wistar, GK and GK+Sita group. Each row represents an miRNA, and each column the study group. The color scale shown at the bottom illustrates the relative expression level of miRNA across all samples. (B) Graphical representation of the most incremented miRNAs in GK group vs. Wistar and GK+Sita group. (C) Clustering representation of the enhanced miRNA in GK group. (D) Validation of the differential expression of miR-21, miR-200a, miR-27b and miR-16. *Statistical p value <0.05 and **p<0.01 using Mann–Whitney test (Wistar vs GK group).
Abbreviation: GK, Goto-Kakizaki.

