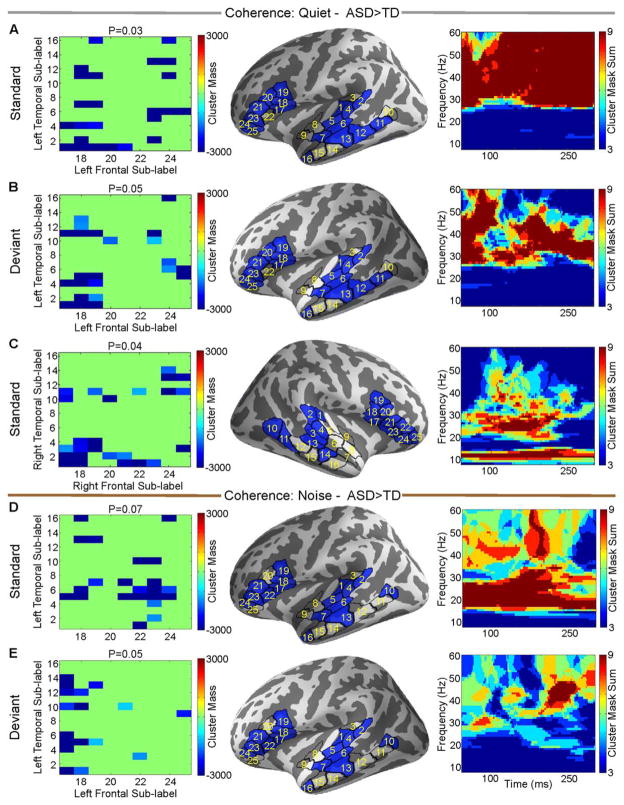
Figure 3.
TD versus ASD based on individual unnormalized coherence estimates within standard or deviant trials for the quiet condition (A–C) and the noise condition (D–E). Directions are marked on figure titles. For each panel, the left column is the matrix of sub-label pairs that reached significance, the middle column shows those labels on the cortex, and the right column is the time frequency map of the sum of the cluster masks between the significant sub-labels from left column.

