Figure 2.

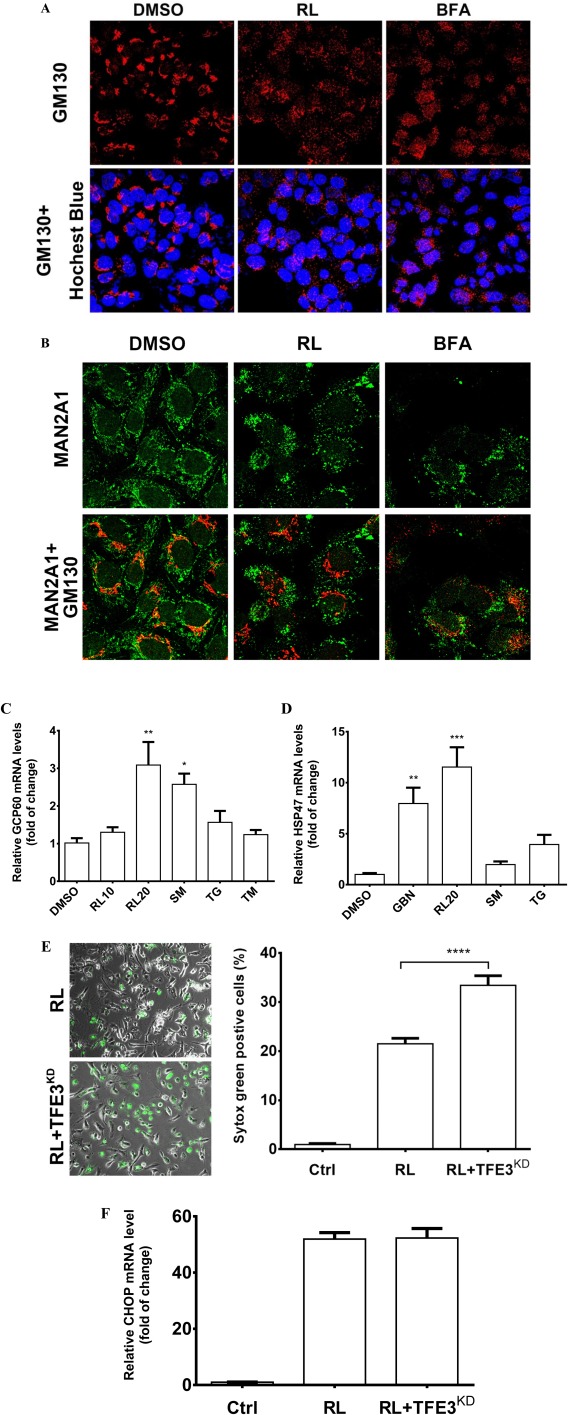
Golgi fragmentation, stress response, and death of liver cells treated with the anti‐HIV drugs. (A) Golgi fragmentation in HepG2 cells. The cells were treated with RL (20 μg/mL), DMSO (0.1%) as vehicle control, or BFA (20 nM) as positive control for 4 hours. The Golgi matrix was labeled with anti‐GM130 antibodies (red), and nuclei were stained with Hoechst blue (blue, ×400). (B) Cellular distribution of MAN2A1 and GM130. The cells were treated with RL, DMSO, and BFA for 2 hours. MAN2A1 and GM130 were labeled by green and red fluorescence, respectively (×630). (C) Expression of Golgi stress marker GCP60 and (D) HSP47 at 8 hours. RL10, RL at 10 μg/mL; RL20, RL at 20 μg/mL. (E) Cell death in the cells deficient in GSR. Cell death was revealed by Syntox green staining (left panel, ×400) and quantified by ImageJ (right panel) 16 hours after the treatments. RL, RL treatment in cells transfected with control siRNA; RL+TFE3KD, RL treatment in cells transfected with TFE3 siRNA. (F) mRNA levels of CHOP at 4 hours. Ctrl, control cells without any transfection or drug treatment; *P < 0.05; **P < 0.01; ***P < 0.005; ****P < 0.0001 compared to control or indicated otherwise; n = 5‐6. Error bars indicate standard error mean (SEM). Abbreviations: GBN, benzyl‐GalNAc; SM, sodium monensin.
