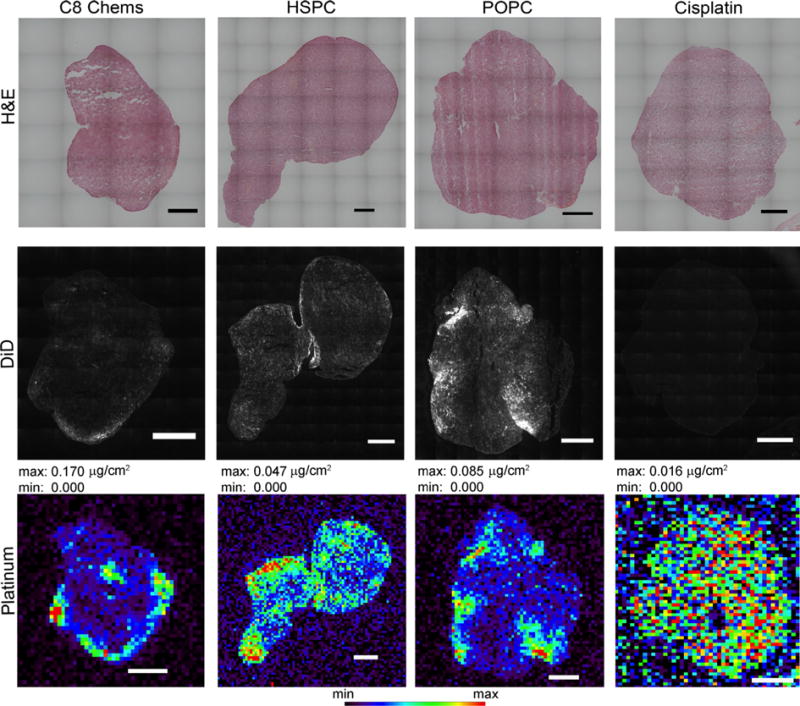
Fig. 3.

Localization of liposome-associated fluorescent dye, encapsulated platinum or non-encapsulated platinum in tumor sections at 54 h post dosing. Microfluorescence of platinum in C26 tumor the scale inserted into the images represents 1 mm. Maximum and minimum threshold values are given which correspond with the rainbow color scale at the bottom of the image.
