
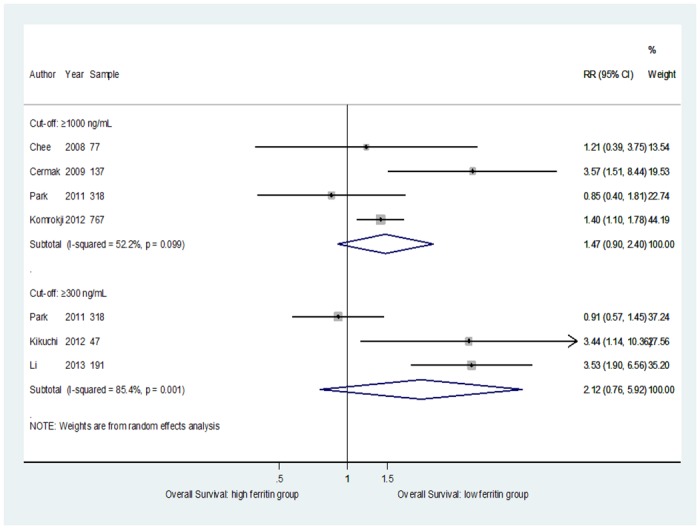
Fig 2. Forest plot of the association of OS and SF according to SF≥1000 ng/ml and SF≥300 ng/ml cut-offs.
Official websites use .gov
A
.gov website belongs to an official
government organization in the United States.
Secure .gov websites use HTTPS
A lock (
) or https:// means you've safely
connected to the .gov website. Share sensitive
information only on official, secure websites.