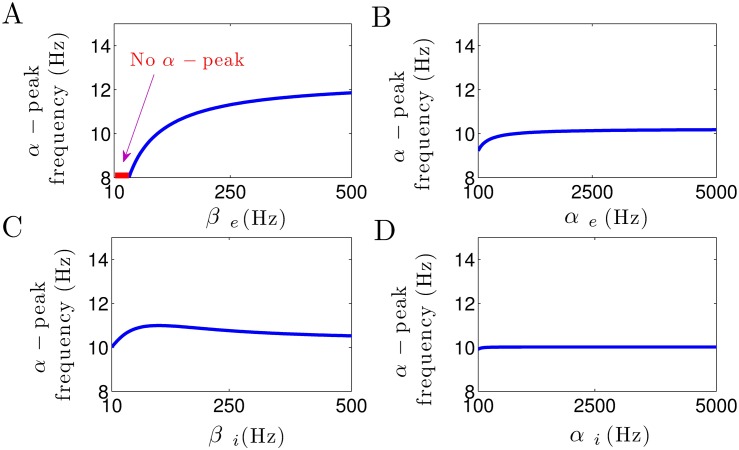
Fig 2. The α–peak depend on synaptic time constants.
(A) Increasing βe increases the α–power peak frequency. The red color shows the region βe < 40 Hz where no spectral power peak in the α–range can be observed. (B) The α–peak frequency remains more or less unchanged by the increase in αe. (C) The increase in βi has an insignificant effect on α–power peak frequency, whereas (D) it remains unaffected by the increase in αi. In all panels, unchanged parameters are taken from Table 1.

