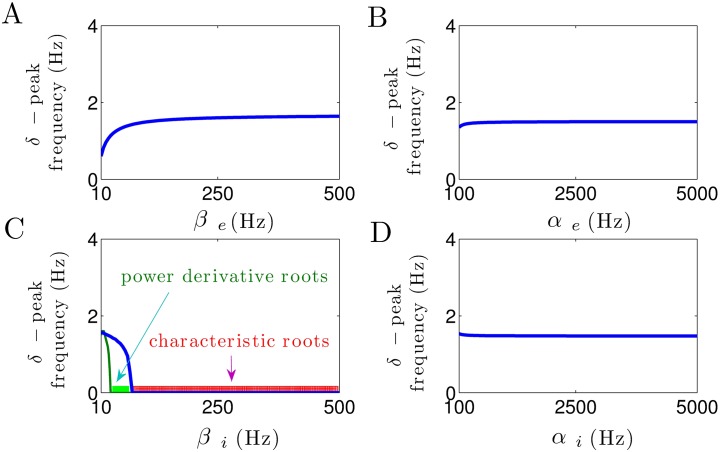
Fig 4. Modulation of δ–peak frequency subjected to excitatory and inhibitory synaptic time constants.
(A) The δ–peak frequency slightly increases with the increase in βe. (B, D) Excitatory and inhibitory rise time constants do not affect the δ–peak frequency. (C) Inhibitory decay time constant heavily affects the frequency of δ–activity. Note that for 30 < βi < 75 Hz, the imaginary parts of characteristic roots in δ–range are not equal to zero (blue line), but the derivative of power spectrum has no roots in δ–frequency range (illustrated by green color). For βi > 75 Hz, the imaginary parts of characteristic roots in δ–range are zero and also the spectral power derivative has no roots (illustrated by red color). In all panels, unchanged parameters are taken from Table 1.

