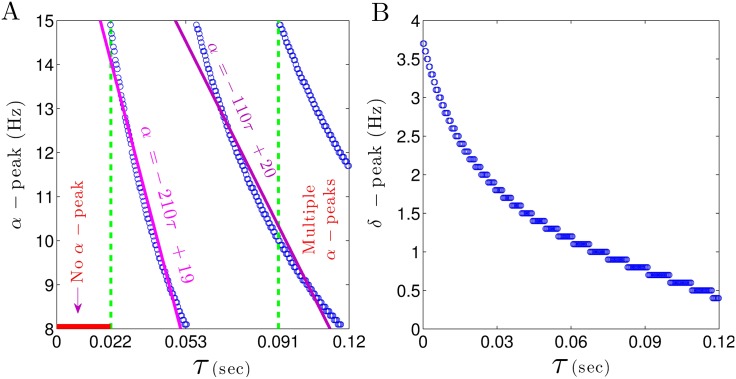
Fig 8. Spectral power peaks in the δ– and α–frequency range depend differently on the CTC delay.
(A) For τ < 0.022 sec no peak in α–range can be observed (marked by a horizontal red line), whereas for τ ≥ 0.022 sec the α–power frequency decreases rapidly. (B) The peak frequency in the δ–frequency range decreases monotonically with increasing CTC delay τ. In all panels, unchanged parameters are taken from Table 1.

