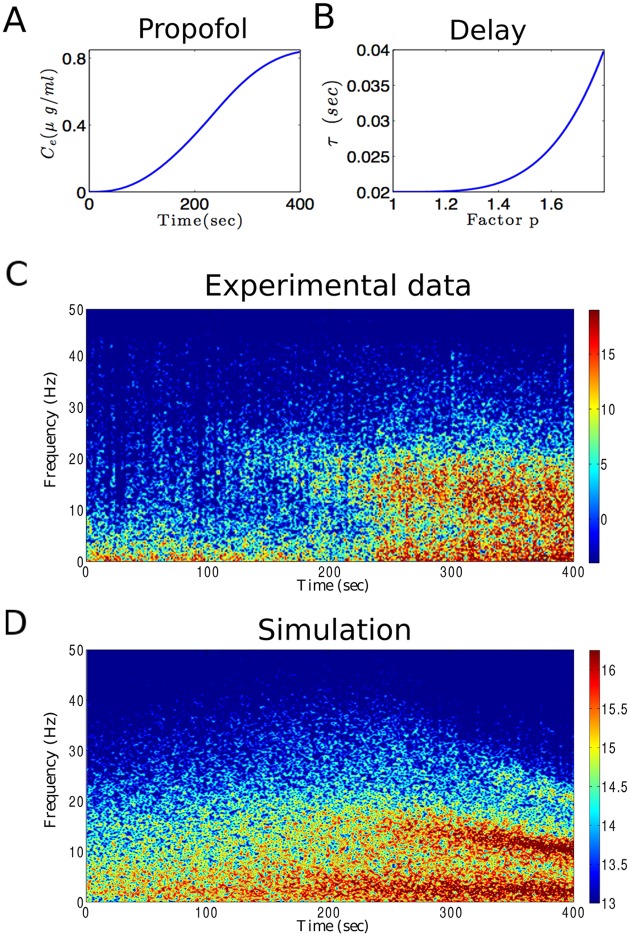
Fig 9. Experimental and theoretical spectrogram during propofol-induced anesthesia.
(A) Effect site concentration of propofol (Ce) as calculated from population based pharmacokinetic modelling (see e.g. [74, 75]) with respect to administration time. (B) To reproduce the shift in the dominant spectral power frequency, it is assumed that the CTC delay τ increases with propofol concentrations according to Eq (17). (C) The spectrogram of frontal EEG power observed in a single subject while the propofol concentration increases. (D) The spectrogram of simulation results based on the model.

