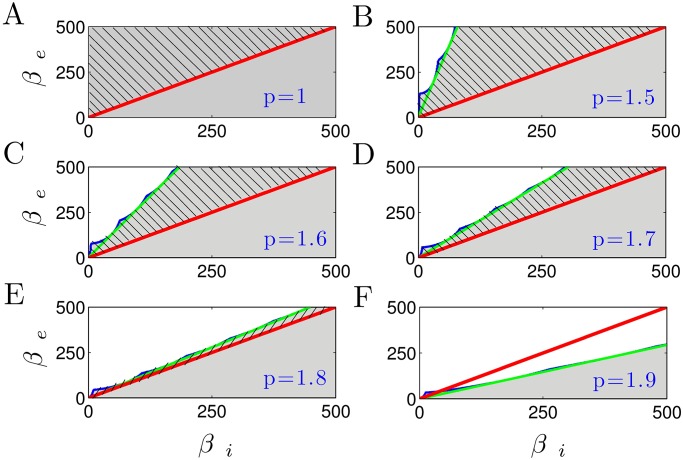
Fig 11. The stability regions with respect to the excitatory and inhibitory synaptic decay rates of the reduced thalamo-cortical model.
The shaded (unshaded) areas represent the parameter regions, where the system exhibits stable (unstable) oscillations. The green lines show the thresholds of parameter zones that are consistent with the multiple constraints (I)-(V), whereas the stability thresholds obtained numerically are encoded in blue lines. The area above the red line indicates the physiologic limit defined by βe > βi. Hence, the shaded region with hatching represents the physiological range of parameter spaces, for which the system is stable. Note that here the CTC delay has a constant value of τ = 0.04 sec.

