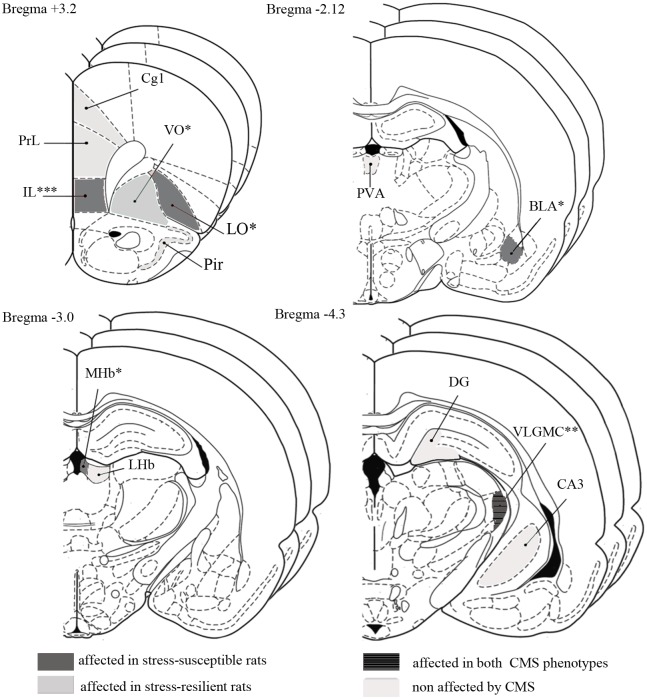
Fig 4. Figure modified from the BRAIN ATLAS [31].
Pictures show 13 different substructures analysed at 3 rostrocaudal levels, within each structure, throughout different brain regions. In grey areas affected in stress-susceptible rats; in dark grey with stripes brain regions affected in both CMS phenotypes; in light grey areas affected in stress resilient rats. In beige, areas not affected by the CMS. DG, dendate gyrus; Cg1, cingulate cortex—area 1; IL, infralimbic cortex; PrL, prelimbic cortex; LO, lateral orbital cortex; VO, ventral orbital cortex; Pir, piriform cortex; PVA, paraventricular thalamic nucleus—anterior part; BLA, basolateral amygdaloid nucleus—anterior part; MHb, medial habenula; LHb, lateral habenula; CA3, field CA3 of hippocampus; VLGMC, ventral lateral geniculate nucleus magnocellular part; * p < 0.05; ** p < 0.01; *** p < 0.001.

