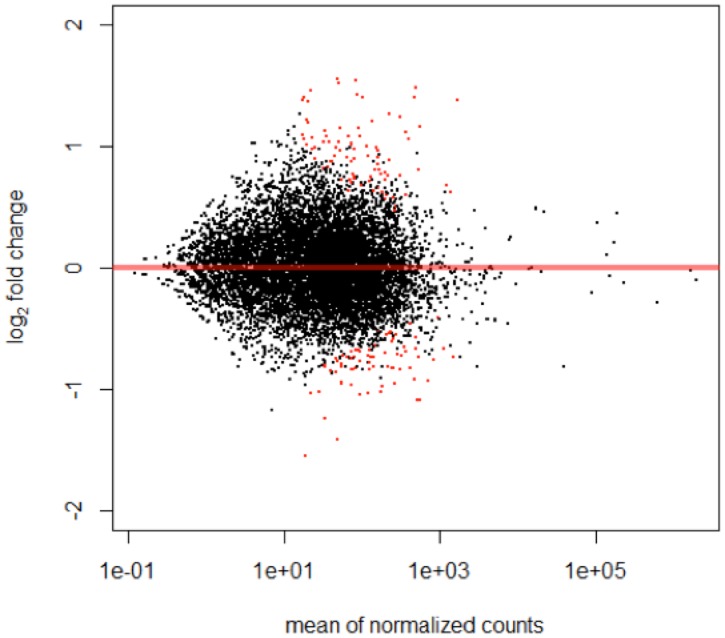
Fig 2. Differential gene expression between SPO3h and SPO12h.

The MA plot of mean expression, that is the average of counts normalized by size factor (x-axis) plotted against Log2change fold 9y-axis), between schistosomula SPO3h and SPO12h (adjusted p-value < 0.05). Transcripts with positive Log2Change fold are up-regulated in schistosomula after 12hours of exposure to hamster portal serum, and those with negative Log2Change fold are up-regulated after 3hours exposure to the portal serum. The red spots represent transcripts with p-values < 0.1, as default.
