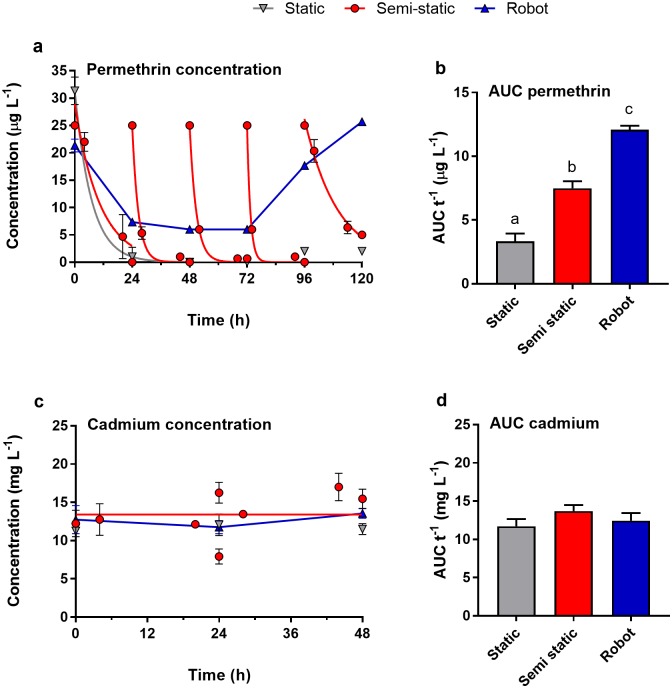
Fig 7. Analytically determined exposure concentrations of permethrin (a) and Cd (c), as well as time-weighted average concentrations (b and d, respectively).
Dots indicate mean ± standard deviation from n = 3 technical replicates for the three exposure scenarios. Time-weighted average concentrations were calculated by dividing the area under the curve (AUC) by the total exposure time.

