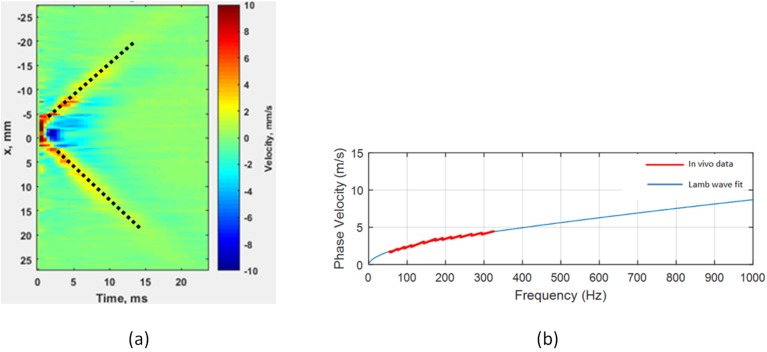
Fig 3.
(a) Spatial-temporal map of the bladder wall motion in response to acoustic radiation force. Dotted lines represent the least square regression for group velocity calculation. The color shows the amplitude of the particle velocity in mm/s. (b) Phase velocity dispersion curve from the two-dimensional Fourier analysis of the displacement data and Lamb wave fit for calculation of the elasticity.

