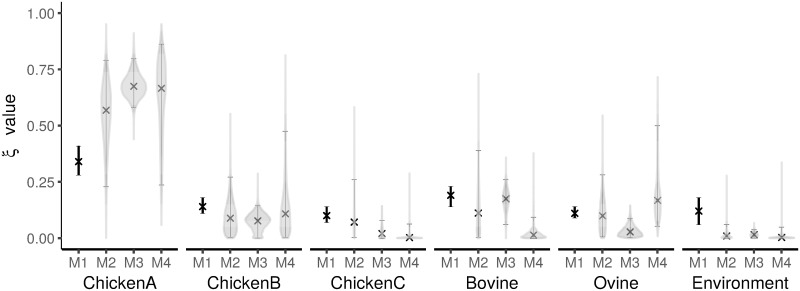
Fig 1. Comparison of the proportion of human campylobacteriosis cases attributable to each source.
The models compared are: M1 (Dutch model), M2 (Modified Hald model), M3 (Island model) and M4 (HaldDP model). Error bars represent 95% percentile confidence or credible intervals with medians shown as a cross. Violin plots show the marginal posteriors of the ξj parameters.

