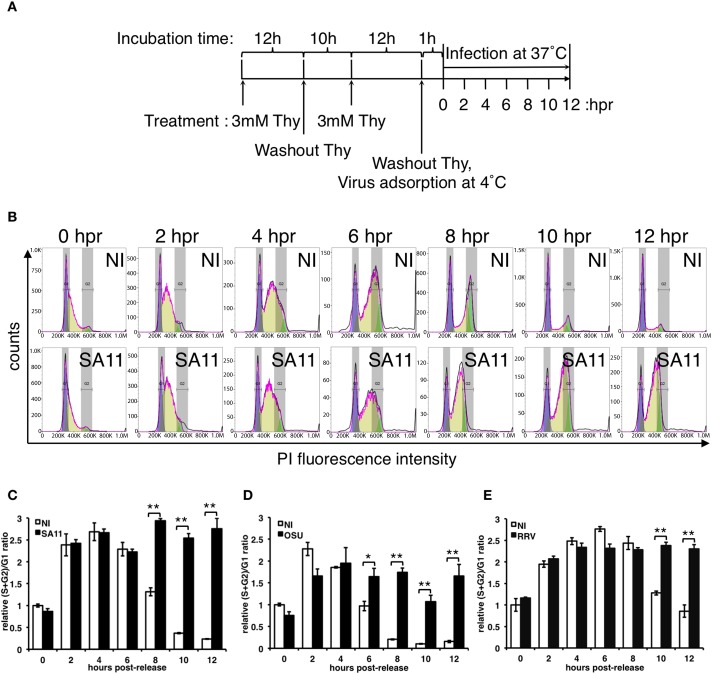
Fig 1. RV-infected MA104 cells get arrested in S/G2 phase in a strain-independent manner.
(A) Schematic representation of the procedure used for cell synchronization by double blocking with thymidine (Thy) and further RV-infection. (B) Flow cytometer histograms of synchronized MA104 cells NI (upper row) or infected with simian RV strain SA11 [MOI, 25 VFU/cell] (lower row) at 0, 2, 4, 6, 8, 10 and 12 hours post-release (hpr) from thymidine block. The histograms overlay the DNA content obtained by the Watson model being purple, yellow and green areas under the curve of G1, S, and G2 phase percentage values, respectively. The plots show the relative (S+G2)/G1 ratio comparing NI and RV-infected [MOI, 25 VFU/cell] cells at each indicated time post-release from thymidine. As indicated, cells were infected with simian SA11 strain (C), porcine OSU strain (D) and simian RRV strain (E). The relative (S+G2)/G1 ratio was calculated considering NI at 0 hpr as a value of 1. Data represent the mean ± SEM from three independent experiments (t-test, *p<0.05; ** p<0.01).

