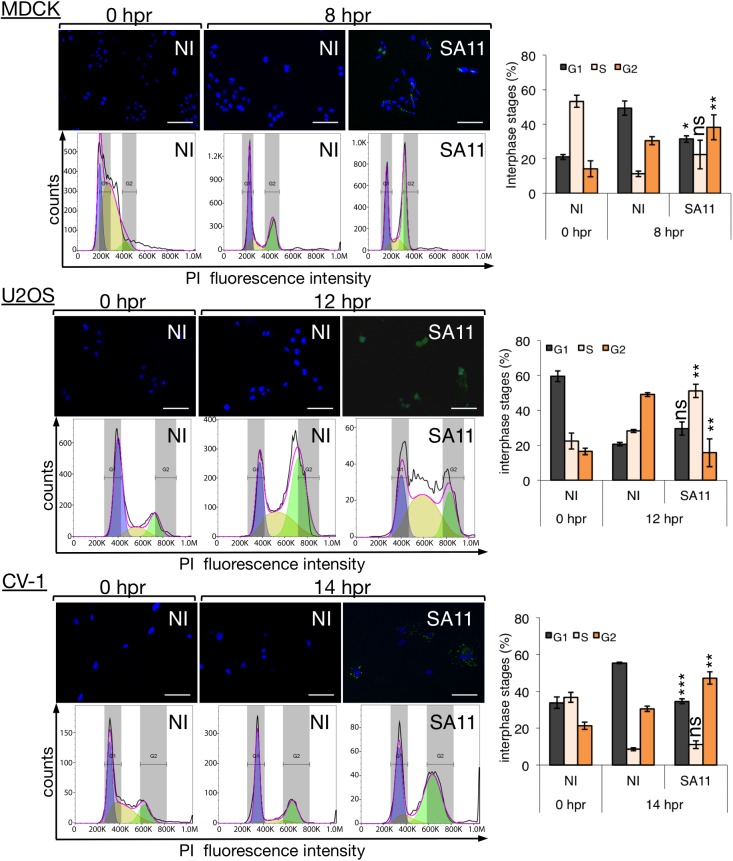
Fig 2. RV-infected cells get arrested in S/G2 phase in a cell type-independent manner.
Flow cytometer histograms from double-thymidine synchronized MDCK (Madin-Darby canine kidney cells), U2OS (human bone osteosarcoma epithelial cells) and CV-1 (monkey kidney cells) cells infected with simian RV strain SA11 [MOI, 25 VFU/cell] and analyzed at 8, 12 and 14 hpr from thymidine. The selected time for analysis was dependent on a previous characterization of a whole replication cycle of each cell type. The histograms overlay the DNA content obtained by DJF mathematical model where purple, yellow and green areas under the curve correspond to the values of G1, S and G2 phases, respectively. An immunofluorescence picture, above each of the DNA content histograms, represents an immunostaining for viroplasms detection (mouse mAb anti-NSP5 [56], green) and stained for nuclei (DAPI, blue). Scale bar is 100μm. The plot, at the right of each panel, compares the percentage of the interphase stages (G1, S, and G2) from NI and SA11-infected cells at the indicated time post-release from thymidine. Each data correspond to the mean± SEM from three independent experiments. The SA11-infected cells compared with NI cells at the same time post-release; where ns, not significant p>0.05, (**) p<0.01 and (***) p<0.001 using two-tailed Student’s t-test.

