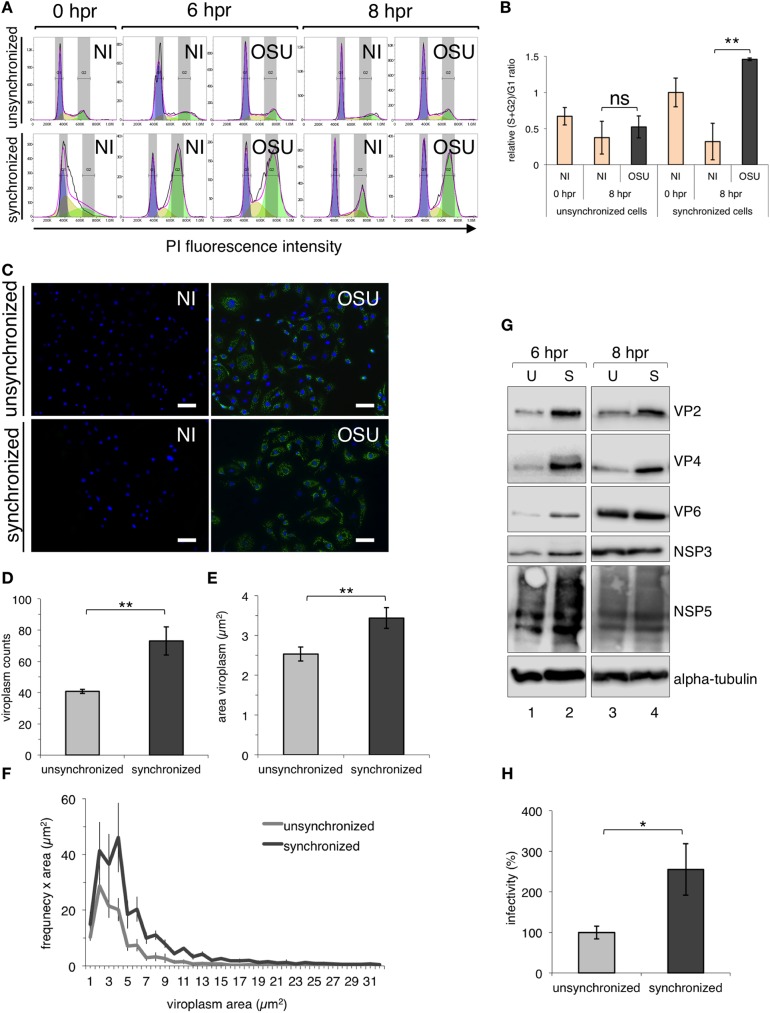
Fig 3. The cell cycle arrest induced by RV in S/G2 phase improves viral replication.
Unsynchronized and synchronized MA104 cells were infected with porcine RV strain OSU [25 VFU/cell] and analyzed at 0, 6 and 8 hpr from double thymidine block. (A) Representative flow cytometer histograms of unsynchronized (upper panel) and synchronized (lower panel) MA104 cells NI or infected with porcine RV OSU strain [MOI, 25 VFU/cell]. The histograms overlay the DNA content obtained by the DJF model where purple, yellow and green areas under the curve correspond to the values of G1, S and G2 phases, respectively. (B) The plot for relative (S+G2)/G1 ratio from comparing NI and OSU-infected unsynchronized and synchronized cells at 0 and 8 hpr from thymidine. The relative (S+G2)/G1 ratio was calculated considering synchronized NI at 0 hpr as a value of 1. Data represent the mean ± SEM from four independent experiments (**) p<0.01 and ns p>0.05). (C) Immunofluorescence of unsynchronized and synchronized cells NI and SA11 infected at 8 hpr from thymidine. The merged images are immunostaining for viroplasms detection (mouse mAb anti-NSP5, green) and nuclei staining (DAPI, blue). Scale bar is 100 μm. The number (D) and size (E) of viroplasms per cell plotted at 8 hpr from thymidine for unsynchronized and synchronized cells. The data represented the mean ± SEM of four independent experiments, t-test, (**) p<0.01; number >150 cells. (F) Distribution of the viroplasm frequency in unsynchronized and synchronized cells at 8 hpr. (G) Immunoblotting from a normalized number of unsynchronized (U, lanes 1 and 3) and synchronized (S, lanes 2 and 4) cells at 6 (lanes 1 and 2) and 8 hpr (lanes 3 and 4). VP2, VP4, VP6, NSP3 and NSP5 viral proteins were detected using anti-VP2, anti-VP5, anti-RV, anti-NSP3 and anti-NSP5 antibodies, respectively. Alpha-tubulin was used as loading control. (H) At 8 hpr, RV-infected unsynchronized and synchronized cells were count normalized, lysed and viral titer was determined. Data are expressed as the percentages of infectivity obtained from unsynchronized cells, which is considered as 100% of infectivity. The data is the mean ± SEM of three independent experiments, t-test, (*) p<0.05.

