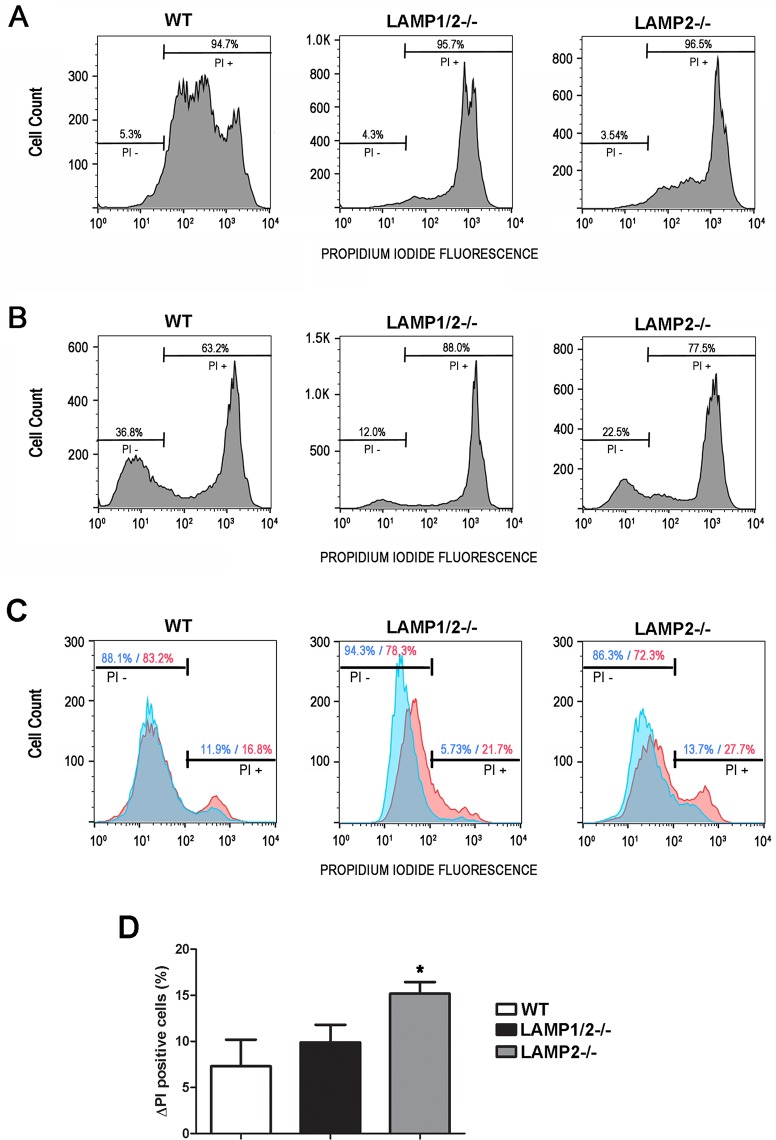
Fig 4. Absence of LAMP-2 does interfere with membrane repair.
(A-B) WT, LAMP1/2-/- or LAMP2-/- were submitted to membrane injury by cell scraping. (A) Cells were scraped in the presence of Propidium Iodide (PI). Histograms show the number of cells presenting PI labeling (PI +), which represent the number of cells that suffered injury during scraping, while cells excluding PI represent those that didn’t suffer membrane injury. Bars above the curve indicate the percentage of injured (PI +) and non-injured cells (PI -). (B) Cells were scraped in the absence of PI, allowed to reseal, and then exposed to PI. Histograms show the number of PI + and PI–cells, which represent the ones that did not or did recover from injury, respectively. Bars above the curve indicate the percentage of non-viable (PI +) and viable cells (PI -). (C) Cells were exposed or not to T. cruzi trypomastigotes for 30 minutes in the presence of Propidium Iodide (PI). Blue curves represent control cultures, without parasite exposure, while red curves represent cell cultures exposed to T. cruzi. Histograms show the number of cells presenting PI labeling (PI +), which represent the number of cells that suffered injury, while cells excluding PI represent those that didn’t suffer membrane injury. Bars above the curve indicate the percentage of injured (PI +) and non-injured cells (PI -) in the presence or absence of T. cruzi. (D) Difference in the percentage of PI+ cells between control and T. cruzi exposed cell cultures. Asteriks indicate statistically significant differences p<0.05. Data shown are representative of three independent experiments.

