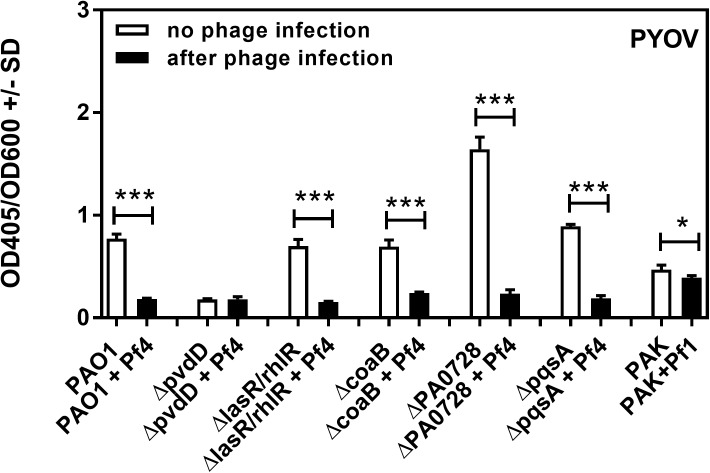
Fig 6. Effect of phage infection on the production of pyoverdine by Pa.
Black bars show pyoverdine production after phage infection, white bars show basal pyoverdine production by planktonic supernatants of the same strains of Pa not infected by phage. One and three asterisks make comparisons within each pair framed by the horizontal bracket; p ≤ 0.05, p ≤ 0.001, respectively.

