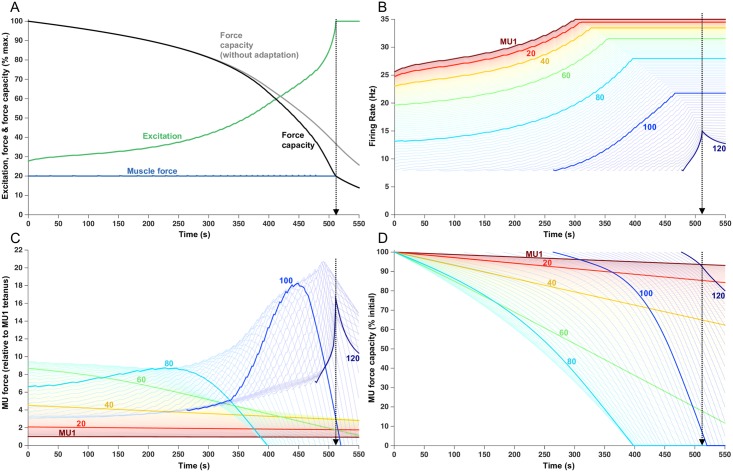
Fig 2. Fatigue model outputs for a sustained 20% MVC force.
The endurance time of 511.5 s is indicated with the vertical dotted lines. (A) Increased excitation in response to fatigue. Force capacity is shown with and without firing rate adaptation and the modeled force remains at the target load until the endurance time. (B) Firing rate of each MU, over the course of the trial. Lines begin when the MU was recruited. Each 20th MU is highlighted and labelled, but all 120 MUs are shown as lighter lines. (C) Force contribution of each MU. (D) Relative force capacity of each MU (normalized to its rested capacity).

