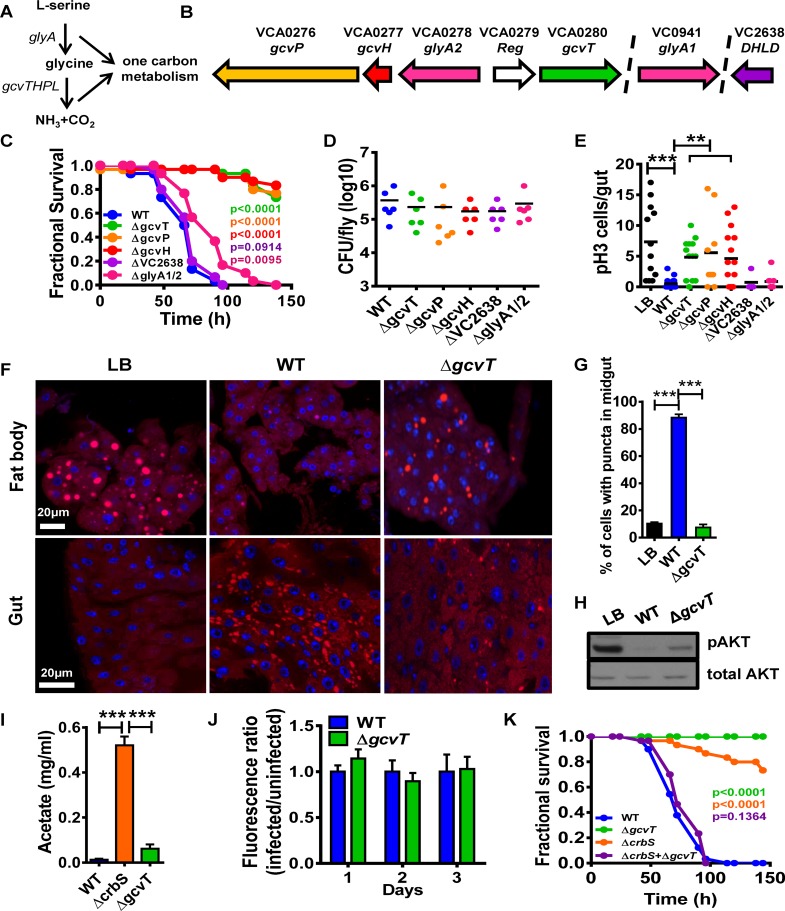
Fig 1. The V. cholerae glycine cleavage system promotes host metabolic disruption and suppression of intestinal stem cell division by a novel mechanism.
(A) Components of the glycine cleavage system. (B) Chromosomal environments of glyA2, gcvH, gcvP, VC2638 and glyA1. (C) Survival curves of Oregon R flies fed LB broth inoculated with wild-type V. cholerae (WT), glycine cleavage system mutants or serine catabolism mutants. (D) V. cholerae colony-forming units (cfu) per fly after 48h of exposure to LB broth inoculated with the indicated V. cholerae strains. (E) Enumeration of PH3+ cells/fly intestine after 72h of exposure to LB broth alone or inoculated with the indicated V. cholerae strains. (F) Nile red staining of neutral lipids in the fat body and intestine of flies fed LB broth alone or inoculated with the indicated V. cholerae strains. (G) Quantification of cells containing lipid droplets in the midgut of flies fed the indicated V. cholerae strains. (H) Western blot analysis of phosphorylated AKT (pAKT) or total AKT levels in whole flies fed LB broth alone or inoculated with wild-type V. cholerae (WT) or a ΔgcvT mutant. (I) Acetate levels in the spent supernatants of wild-type V. cholerae (WT) or ΔcrbS and ΔgcvT mutants cultured in LB. (J) Fluorescence ratios of flies fed LB supplemented with fluorescein either alone or inoculated with wild-type V. cholerae or a ΔgcvT mutant and harvested at the indicated time. (K) Survival curves of Oregon R flies fed LB broth inoculated with wild-type V. cholerae (WT), a ΔcrbS mutant, a ΔgcvT mutant, or a combination of both. For pooled data, the mean and SD are shown. Pairwise statistical significance was calculated using a student’s t-test (*p<0.05, **p<0.01, ***p<0.001). For survival curves, statistical significance was calculated by log-rank analysis.

