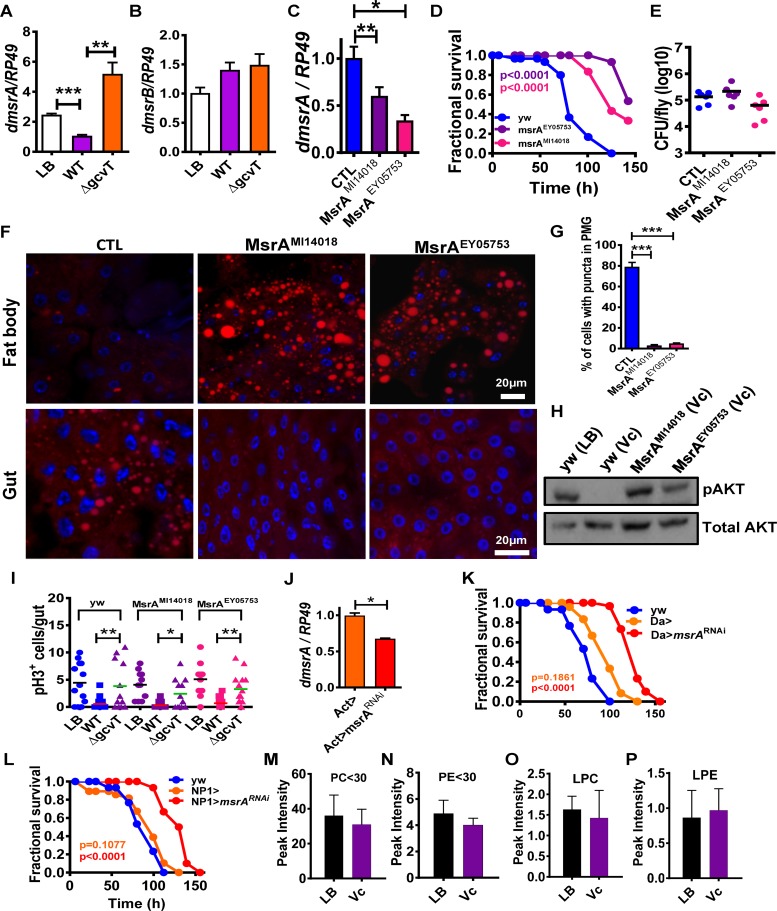
Fig 5. Inactivation of host methionine sulfoxide reductase in the setting of wild-type V. cholerae infection phenocopies infection of control flies with a V. cholerae ΔgcvT mutant.
Transcription levels of (A) dmsrA and (B) dmsrB in the intestines of flies infected with wild-type V. cholerae (WT) or a ΔgcvT mutant. (C) Transcriptional levels of msrA in control flies (yw) as well as fly lines carrying the two mutant alleles studied here, msrAMI14018 and msrA EY05753. (D) Fractional survival of control (yw) or dmsrA mutant flies infected with wild-type V. cholerae. (E) Bacterial burden of control (yw) flies and dmsrA mutants after infection with V. cholerae. (F) Nile red staining of neutral lipids in the fat body and intestine of wild-type (yw) or dmsrA fly mutant flies fed wild-type V. cholerae. (G) Quantification of midgut cells containing lipid droplets. (H) Western blot analysis of phosphorylated AKT(pAKT) or total AKT levels in whole control (yw) or dmsrA mutant flies fed LB broth alone (LB) or inoculated with wild-type V. cholerae (Vc). (I) Enumeration of PH3+ cells in the intestines of control (yw) or dmsrA mutant flies fed LB broth alone or inoculated with wild-type V. cholerae (WT) or a ΔgcvT mutant at 72h. (J) Levels of msrA transcription in control (Act-Gal4>) and Act-Gal4>msrAV48990-RNAi flies. (K) Fractional survival of control (yw), Da-Gal4>, or Da-Gal4>msrA V48990-RNAi flies infected with wild-type V. cholerae. (L) Fractional survival of control (yw), NP1>, or NP1>msrA V48990-RNAi flies fed with wild-type V. cholerae. (M-P) Lipidomics analysis of the intestines of msrA EY05753 flies fed LB alone (LB) or inoculated with wild-type V. cholerae (Vc). (M) Total phosphatidylcholine species with fatty acid carbons less than or equal to 30 (PC≤30). (N) Total phosphatidylethanolamine species with fatty acid carbons less than or equal to 30 (PE≤30). (O) Total lysophosphatidylcholine species. (P) Total lysophosphatidylethanolamine species. For pooled data, the mean and SD are shown. Pairwise statistical significance was calculated using a student’s t-test (*p<0.05, **p<0.01, ***p<0.001). Log-rank analysis for survival curves (*p<0.05, **p<0.01, ***p<0.001).

