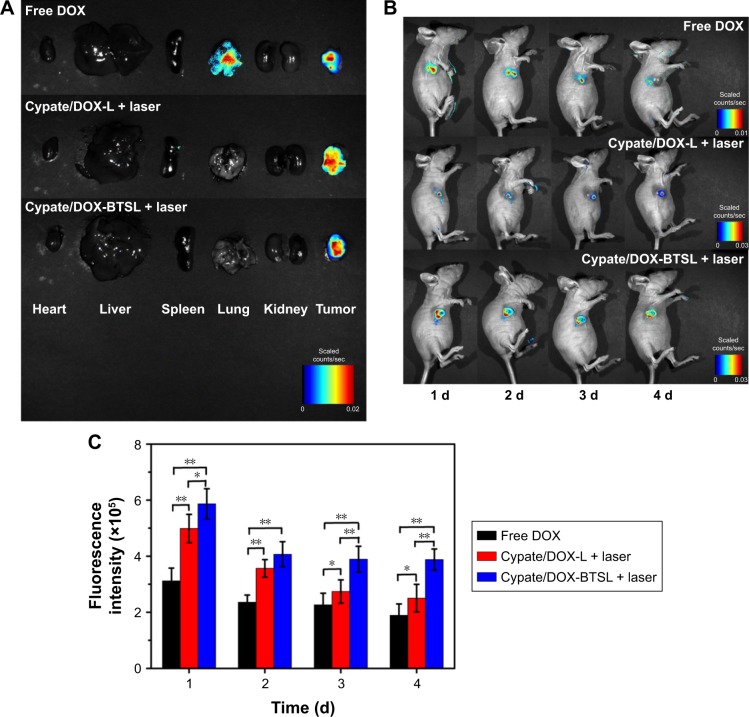
Figure 8.
Ex vivo fluorescent images of major organs and tumors from the nude mice at 24 h postinjection (A). In vivo imaging (B) and its fluorescent intensities (C) of the mice around the tumor at 1, 2, 3, and 4 d postinjection, respectively. The data are shown as mean ± SD (n=4, *P<0.05, **P<0.01).
Abbreviations: SD, standard deviation; DOX, doxorubicin; L, (NH4)2SO4 liposomes; BTSL, bubble-generating thermosensitive liposomes (NH4HCO3).

