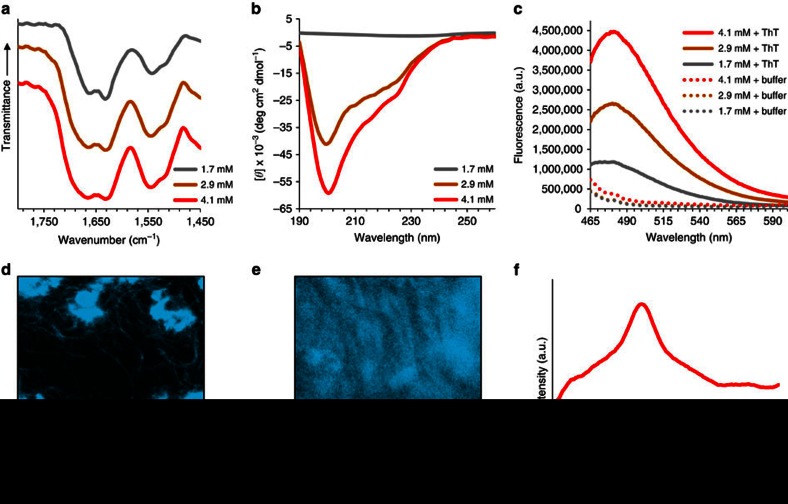
Figure 2. Secondary structure analysis of the 20-mer peptide in phosphate buffer.
(a) FTIR spectra of dried peptide samples at three concentrations. (b) CD spectra of peptide solutions at three concentrations. (c) Fluorescence emission spectra of peptide preparations at three concentrations, in the presence or absence of ThT, upon excitation at 440 nm. (d) CLSM imaging of 1.7 mM or (e) 4.1 mM peptide concentrations in the presence of ThT. (f) Radial averaging of the X-ray fibre diffraction pattern obtained from dried stalks of the peptide at 4.1 mM. Scale bars in d and e are 10 μm.

